We have often heard the old adage, «money can’t buyhappiness» but how much of that is reallyfactual in today’s society? COVID-19 has not onlyaffected people’s health but their finances too.So how strong is the link between income and well-being?In this study, we examine therelationship between happiness and a variety of economicand social factors to answer that veryquestion. Using 25 independent variables to representeconomic development, trade andglobalization, governance, health spending and statefragility across 106 countries, severalregressions were run to see the relation between thosevariables and the Gallup’s World Pollused for the Happiness Index.
GDP per Capita
From 2008 to 2019, GDP per Capita, PPP was the leadingfactor affecting people’shappiness globally. However, GDP per Capita was closely followed by youthunemployment, social support,health spending and generosity. Collectively, thesefive indicators account for 74.4% ofpeople’s worldwide happiness.○Economic indicators were most likely estimators ofhappiness in the Americasand social indicators were leading in Africa.○In the APAC, happiness was equally affected by botheconomic and governanceindicators , whereas in Europe governance indicatorswere most likely estimatorsof happiness.○Europe stood out as the only region where rule oflaw was the most importantindicator of happiness, followed by GDP and politicalrights. With nine out of tenhappiest countries in the world being in Europe, perhapsthe dominance ofgovernance indicators is suggestive of the key rolethey play in a region with thehighest number of developed economies.
However, from 2017 to 2019, with political tensionson the rise globally due to migrantcrises, rise of extremism, Brexit and the US-Chinatrade war, fragile state index was theleading indicator accounting for 61.19% of people’shappiness worldwtical analysis of 25 indicatorsacross 106 countries between 2008 and2019, we found that 74.4% of people’s happiness worldwidecan be attributed to a combinationof the top 5 indicators, in the order of importance.While GDP per capita is leading, botheconomic and social indicators take the lead whenit comes to global analysis of happiness.
Key Findings
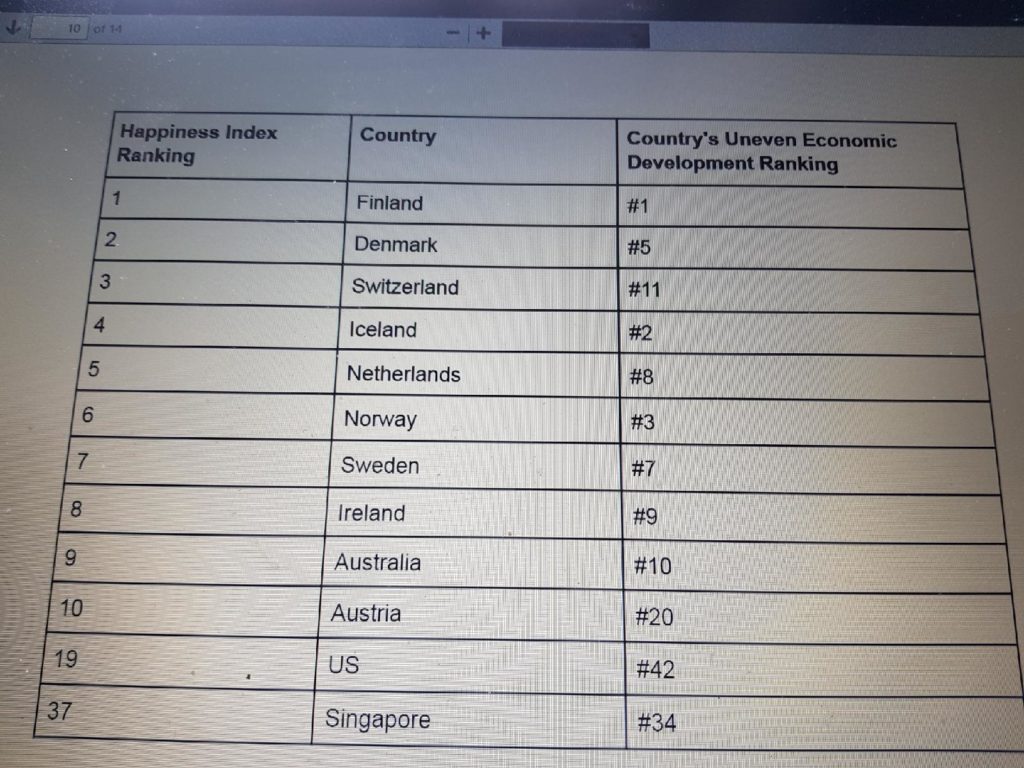
From 2008 to 2019, GDP per Capita, PPP was the leadingfactor affecting people’shappiness globally.●However, GDP per Capita was closely followed by youthunemployment, social support,health spending and generosity. Collectively, thesefive indicators account for 74.4% ofpeople’s worldwide happiness.○Economic indicators were most likely estimators ofhappiness in the Americasand social indicators were leading in Africa.○In the APAC, happiness was equally affected by botheconomic and governanceindicators , whereas in Europe governance indicatorswere most likely estimatorsof happiness.○Europe stood out as the only region where rule oflaw was the most importantindicator of happiness, followed by GDP and politicalrights. With nine out of tenhappiest countries in the world being in Europe, perhapsthe dominance ofgovernance indicators is suggestive of the key rolethey play in a region with thehighest number of developed economies.●However, from 2017 to 2019, with political tensionson the rise globally due to migrantcrises, rise of extremism, Brexit and the US-Chinatrade war, fragile state index was theleading indicator accounting for 61.19% of people’shappiness worldwide.Happiness IndexThe Happiness Index is compiled every year by theWorld Gallup Poll, with the respondentsacross 146 countries being asked to rank their lifeon a scale of 0 to 10, with 0 being the worstpossible life and 10 being the best. When analyzingthe top countries on the Happiness Indexlist each year, it becomes apparent that while manyare developed economies, GDP per capitawas not a good indicator of happiness.
Methodology
We collected data for 25 independent variables usingthe World Bank, the Heritage Foundation,Fund for Peace and several other sources. The dependent variable in the study is theHappiness Index, which comes from the Gallup WorldPoll. Data was collected and analyzedfor 106 countries between 2008 and 2019 and regressionanalysis was conducted on the entiredataset as well as its various subsets.In order to determine the factors that influence happinessthe most on a global as well asregional levels, we have used a multivariate regression.The first step was to reduce the set of25 potential variables to a subset of only five variablesthat provide the highest explanatoryvalue, measured by the overall coefficient of determination(R-squared). In other words, weused an algorithm that for a global and regional analysesreturns those five explanatoryvariables that maximize R-squared.Once we determined those variables, as a second stepwe ranked them in order of importanceby using standardized, coded coefficients. More specifically,we standardized each coefficient bydeducting the mean and dividing the result by thestandard deviation of the underlying variable.While this method renders the coefficient unitless,and therefore makes it harder to interpretthose on an individual basis, it enabled us to rankthem in order of impact on happiness, sincethis methodology takes mean and variation of eachunderlying variable into account. Ultimately,this standardization makes a comparison of absolutevalues of each coefficient possible
Data Limitation
sPossible shortcomings of the regression analysis includedata and variable limitations. With over193 countries in the world, crucial data was missingfor nearly half, making the analysis morechallenging. Regarding the independent variable whichis the Happiness Index from the GallupWorld Poll, it was only available for 146 countries.Of those 146 countries, the 25 independentvariables data was only available for 106 countries.As a result, regression analysis was onlydone for those 106 countries.Data QualityOf the 25 independent variables, 3 variables (happinessindex, social support and generosity)were fully reliant on survey data from Gallup’s WorldPoll, which is subjective in nature. Inaddition, data was collected from different sources,which can vary in their quality. Data sourcesinclude the World Bank, the Heritage Foundation, Fundfor Peace, the Freedom House, Foodand Agriculture Organization, The Swiss Instituteof Technology in Zurich and The World Happiness Report.